Aggregate
An aggregate is a single result based on a set of multiple input values. Using operators, such as SUM and Average, you can input multiple values and then summarize your data. With the Aggregate tool, you can perform one of the following scenarios:
Perform an aggregate operation on a column.
Arrange data into groups.
Arrange your data into groups and apply an aggregate operation.
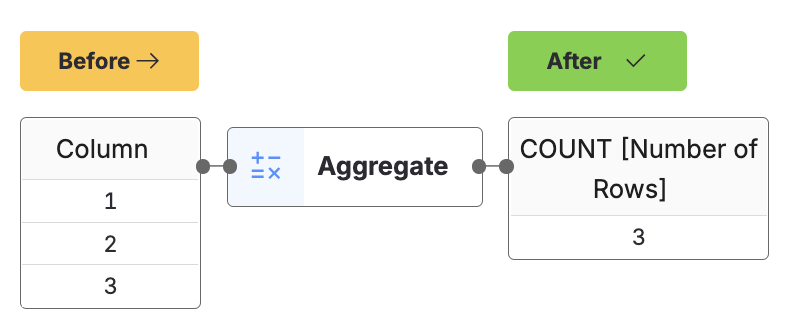
For example, you can use the Aggregate tool with the operator COUNT to count the number of rows in your data.
The aggregate tool offers the following operators: MAX, MIN, COUNT, SUM, AVERAGE, MEDIAN, OR, AND, and STDEV. For more information, see the Aggregate tool configuration section.
Tip
Pay attention to the data and logic as you build, and aggregate where appropriate. For example, if you use the Select tool to drop columns, you may need to aggregate any numeric values. If you expect the same results, avoid creating an aggregate output for Reports, and a non-aggregate output for calculations. In this case, use the aggregate output.
Input
The Aggregate tool requires one data input.
Configuration
Use the following configuration options to configure the Aggregate tool.
Go to the Pipes module from the side navigation bar.
From the Pipes tab, click an existing pipe to open, or create a new pipe. To create a new pipe, read the Creating a pipe documentation.
In the Pipe builder, add a data source to your pipe. For more information on adding a data source, see the Data Input tool.
Click
 + Tool.
The Tools modal opens, where you can add tools, such as the Aggregate tool, to your pipe.
In the Tools modal, search for Aggregate and then click + Add tool.
Tip
You can also find the Aggregate tool in the Calculate section.
Click the tool node and drag the line to the next tool to connect the tools. If you need to undo the action, click the line and then click Unlink.
In the configuration pane, select the Aggregate columns Group by checkbox if you want to group the columns that you want to aggregate based on the values of an existing column.
Under Decimal places, select the checkbox to add decimal places. Enter the number of decimal places, or use the arrows to increase or decrease the value. The limit is 14 decimal places.
Under Column, select the column to aggregate from your data set.
Under Operation, select the operation to use from the drop-down menu:
SUM: Use to find the sum of the value.
COUNT: Use to count the value.
Note
You can use the COUNT operation without selecting an aggregate column.
AVERAGE: Use to find the average value.
MIN: Use to find the minimum value.
MAX: Use to find the maximum value.
MEDIAN: Use to find the median value.
OR: Use to find specified conditions. One of the records must be
true.Note
The
ORoperator must be used only with boolean values.AND: Use to find specified conditions. All of the records must be
true.Note
The
ANDoperator must be used only with boolean values.STDEV: Use to find the standard deviation across the values.
Under Column name, enter a name for the new column. For example, if you are using the Aggregate tool to calculate your seller's estimated amount of commission, you may name the column
Total commission.Optionally, click + Add column to add a new aggregate column.
Click on the tool name to rename your tool node to a meaningful name. Name your tools in a way that describes the function, not the object or the data action. For example, use “Look up rate” instead of “Join to rate table”.
Usage example
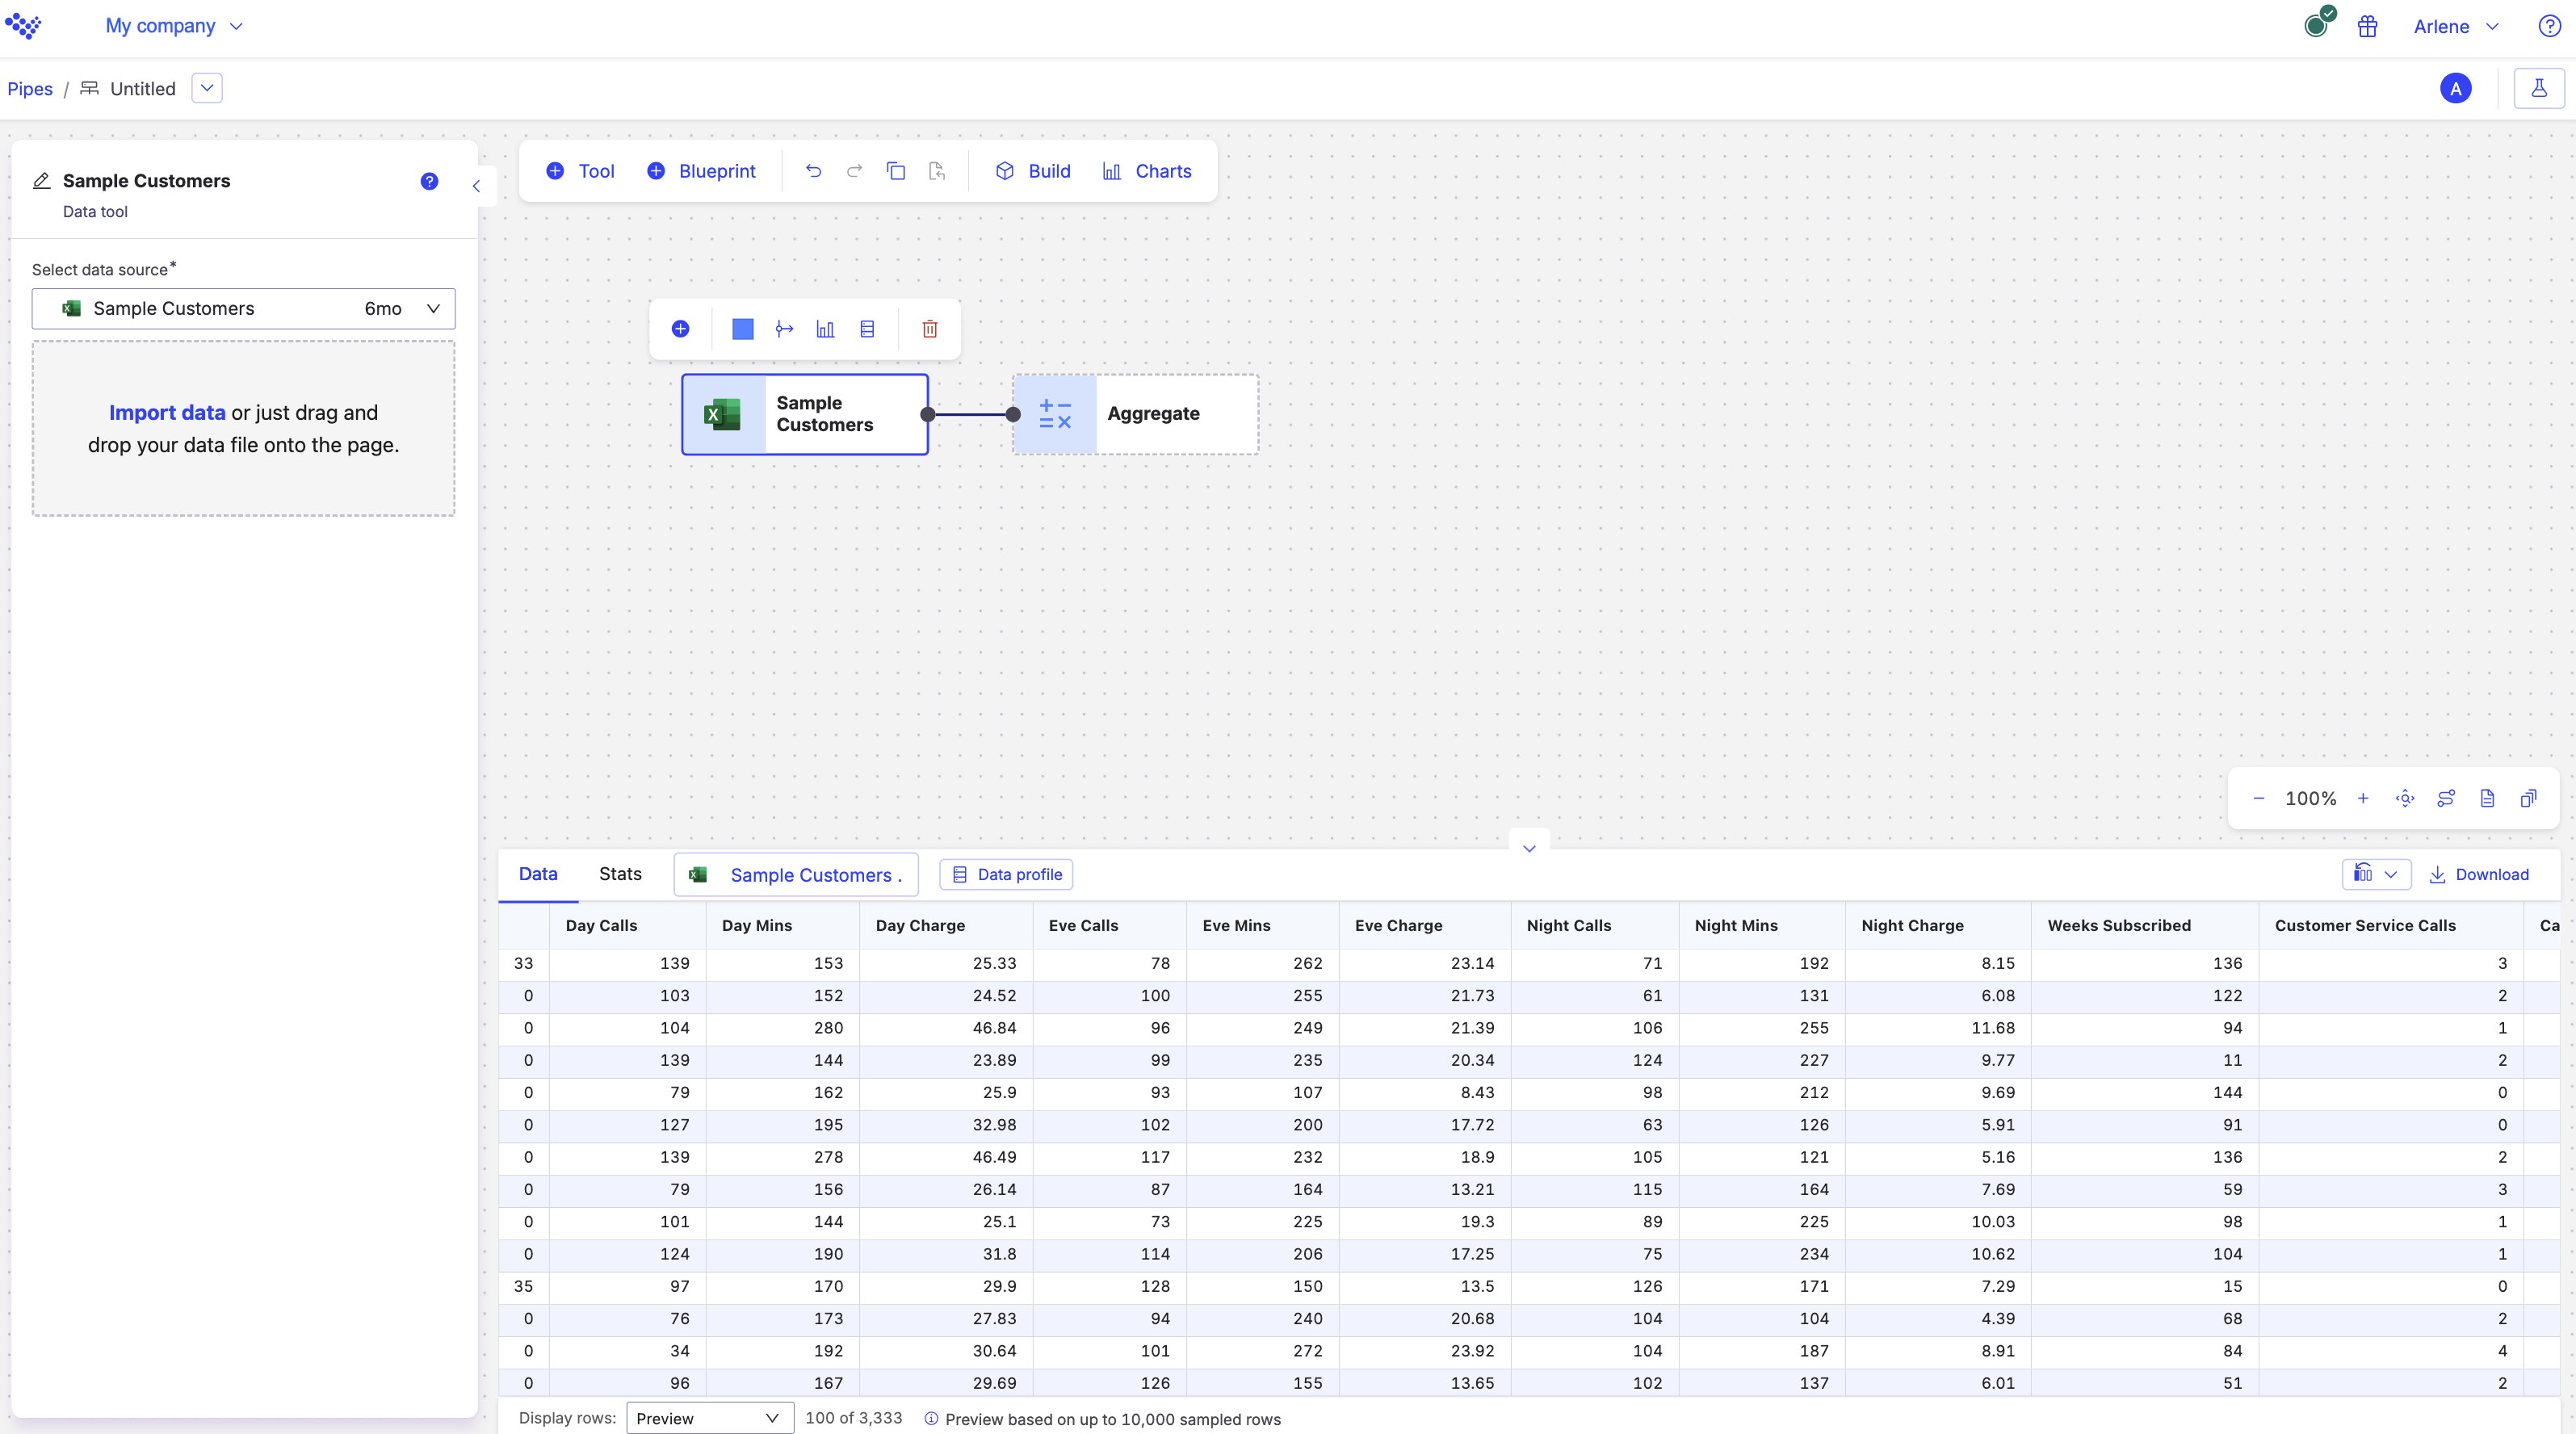
Let's use the Aggregate tool to return the total row count for our data set. In this example, we will be trying to discover how many calls were placed to customer service by our customers. The following is an image of the data set we are working with:
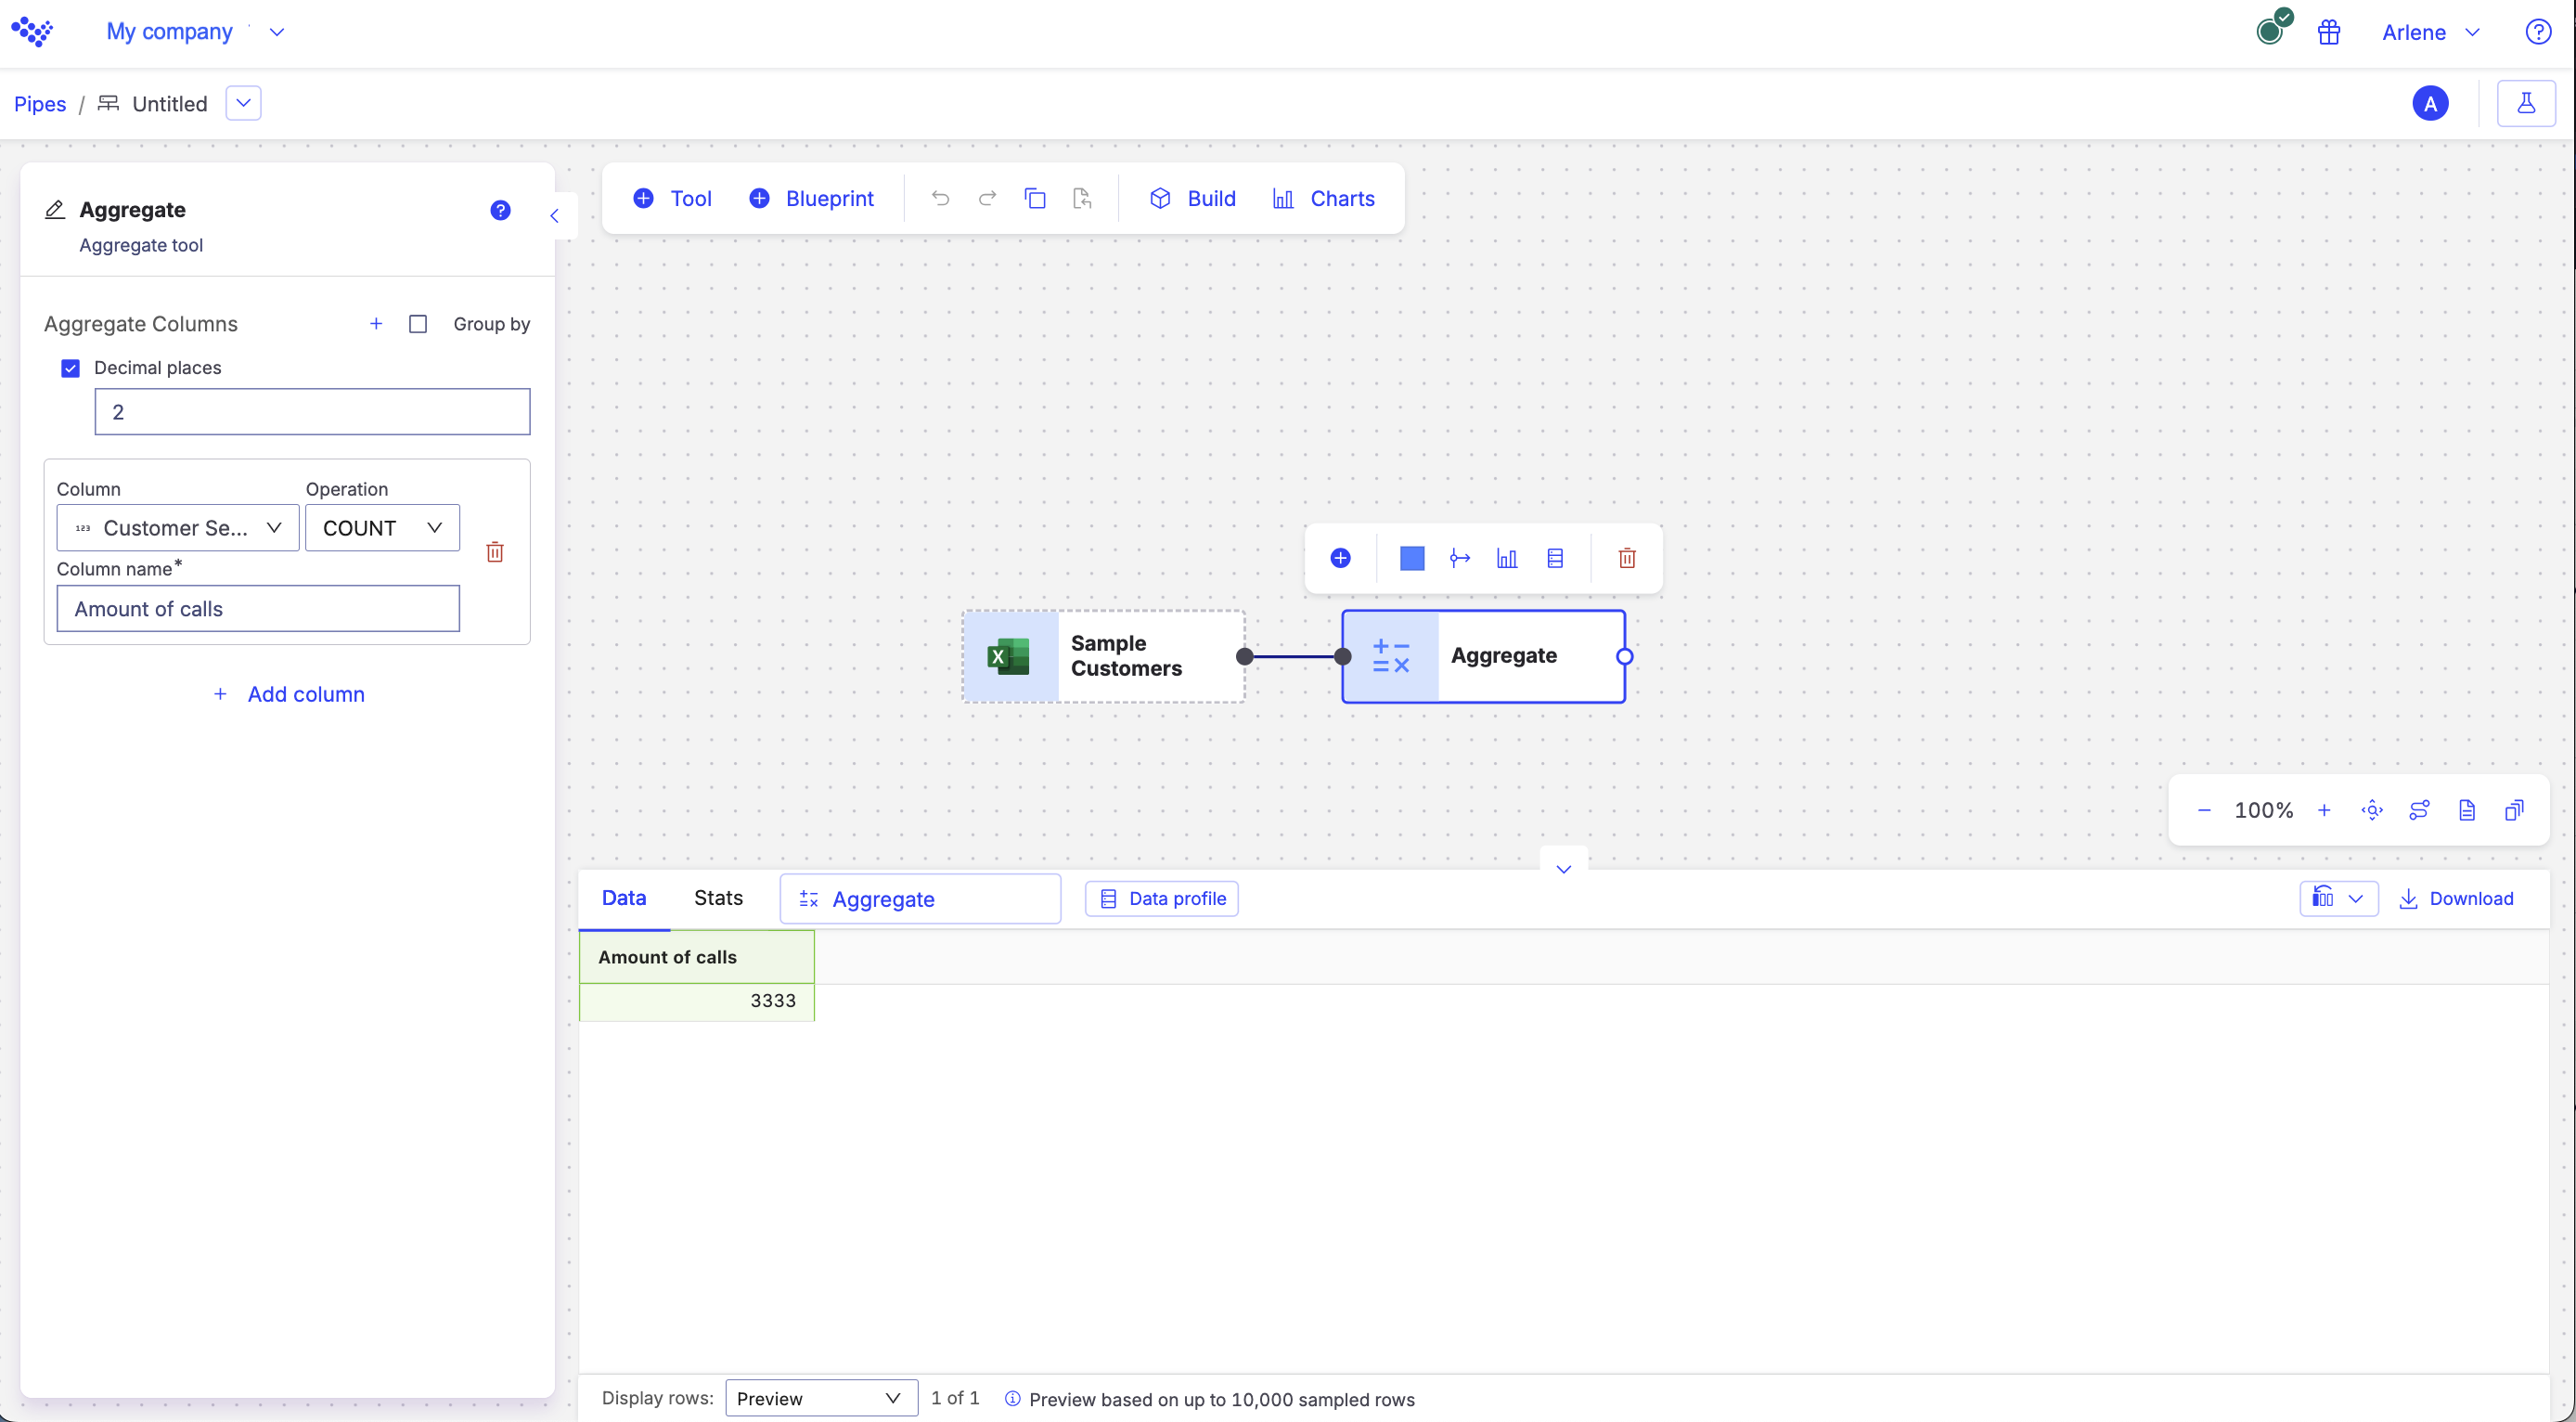
In the Aggregate configuration pane, let's configure the following values:
Leave the Group by and Decimal places checkboxes blank.
In the Column field, use the
Customer Service Callscolumn to aggregate.In the Operation field, select the
COUNToperator.In the Column name field, enter the name of the new column, Amount of calls.
Build your pipe.
In the new column, you will now see that the amount of calls placed to customer service is
3333.