Row Viewer
Row Viewer is a preview of your data, supporting 500-plus columns, that is always available in your pipe. Use the row viewer to create specific columns for your numbers or dates.
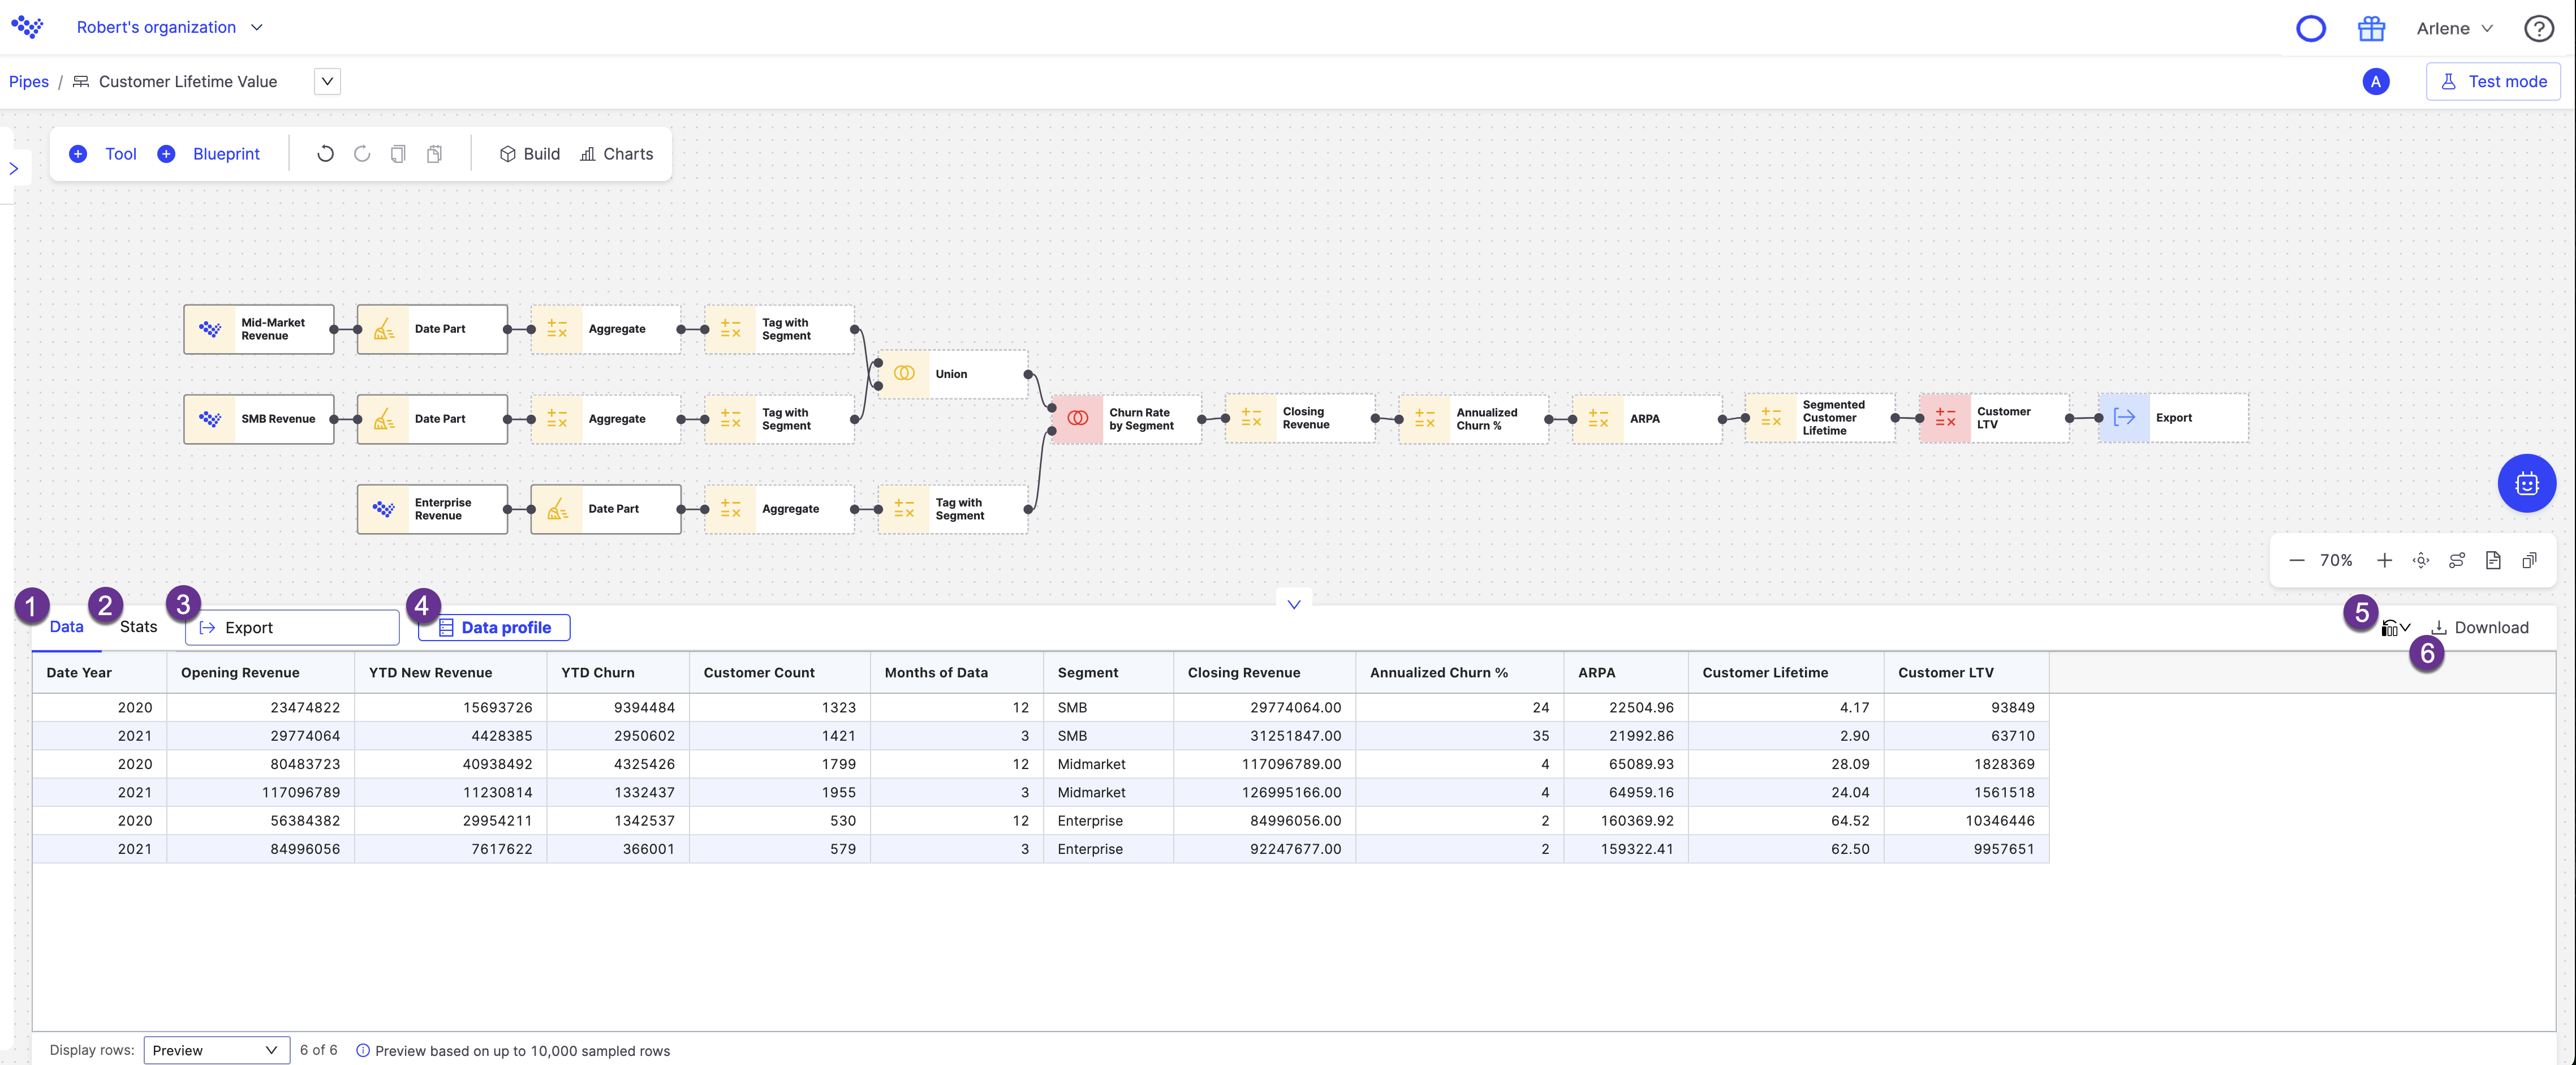
Data tab: Displays information from your data set within the Row viewer.
Stats tab: Displays statistics about your dataset.
Tool tab: Toggle between your data set and a tool in your pipe to see new insights.
Note
This tab is only available with certain data science tools, such as the Predictor, Classifier, and Regressor tools.
Data profile: Display a deeper dive into your data set, including column details, correlation, and column comparison charts.
Formatting: Arrange your data to your needs by choosing to Modify columns in front, or Preserve native column order.
Download: Save a local copy of your data.
Row viewer format
The Row viewer is a versatile tool to use for your data set. When you open a pipe, the Row viewer remains collapsed by default. When you open the Row viewer, it stays expanded as you navigate between tools in the Pipe builder. If you resize the Row viewer, the custom size is maintained until you collapse and re-expand, at which point it returns to the default size.
You can format multiple columns at the same time. Simply use the Shift key to select the columns that you want to format.
You can see the total number of rows in your data without counting or opening the dataset in the Row viewer, where the count is displayed at the bottom.
All data inherits the formatting, either from the data import into Varicent ELT, or if you choose to apply a new format. The filtering option indicates in blue that the filtering is applied. Any new tools that you add to the pipe inherit this format.
Note
Formatting does not carry over to the raw data or to the downloaded versions (CSV, PDF, PNG) of your data.
The following tools can change the column type, but do not inherit the row viewer from other tools:
Adapt
Change Type
Date Format
You can use the reset format to restore your data or dates to their original format.
New columns, default formatting
The following tools add new columns to your data and come with the default formatting:
Moving Average Forecast
Forecast
Aggregate
Binning
Combination Matcher
Date Add
Date Aggregate
Formula
Quantile
Segmentation
Classifier
Regressor
Predictor
Running Total/Average
Weighted Average
Some tools create a new column called Probability, displayed as a percentage with no decimal places.
Numeric Format
Apply the following formats to the rows in your data column:
Format | Description |
|---|---|
None | Removes the applied formatting. |
Dollar | Adds a dollar sign to the specific column. |
Percentage | Adds a percentage sign to the specific column. |
Decimal places | Increase or decrease the number of decimal places. |
Note
With decimal places, the formatting skips blank rows and starts formatting at the first number in the data.
You can also toggle the 1000's separator on and off.
Important
Calculations with the following five operators generate the output format based on priority:
+
-
*
/
%
For example, currency > regular number > percentage. If number one is currency and number two is a percentage, number one multiplied by two outputs the currency. If the two operands are set with the same decimal place, the decimal place remains. If the operands are both set with thousand separators, the separators remain. If this is not the case, the decimal places and thousand separators are ignored.
Date Format
There are five date format options to choose from:
Format | Example |
|---|---|
Short Date | 21-01-24 |
Long Date | Monday, January 24, 2001 |
Time | 12:00 AM |
Full Date and Time | 21-01-24 12:00 AM |
Short Month | Jan 2021 |